
how calculus predicts the weather
a story about the intermediate value theorem

When I was in high school, my math teacher asked the class a question which I still think about quite often.
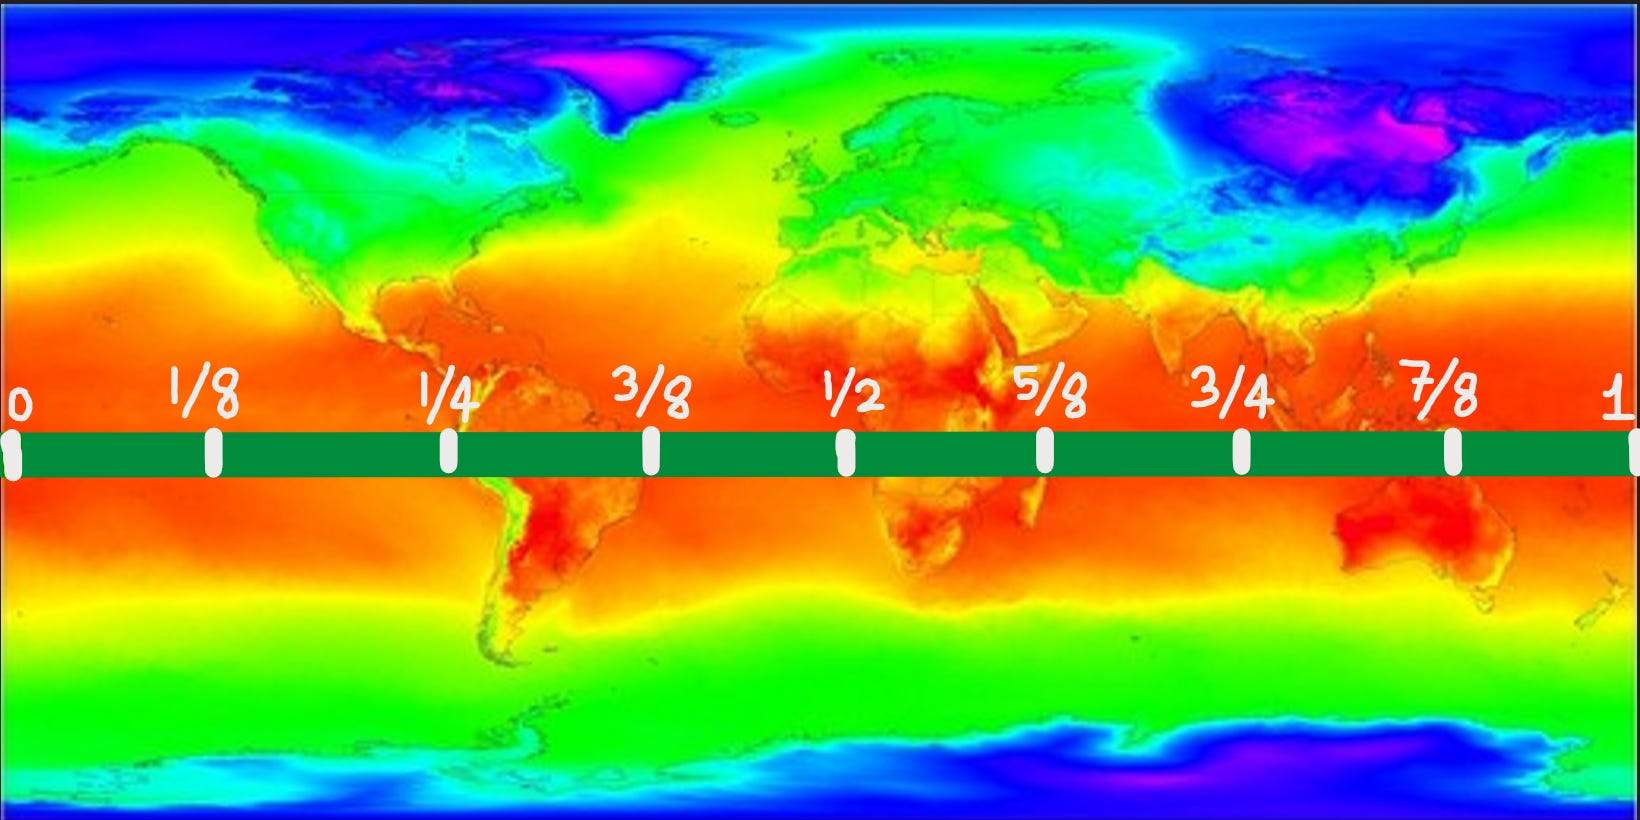
Can you show that, at any time, there are two different points on the Equator that have the same temperature?

I thought: is this even math class? Am I in the right room? Perhaps I’d walked into a science class by accident.
But no, this was indeed a math class!
In this issue, I want to explain how you can solve this problem using calculus: namely, an important fact called the Intermediate Value Theorem.
But before that, we need to remember an important concept from high-school calculus: that of a continuous function.
continuous functions
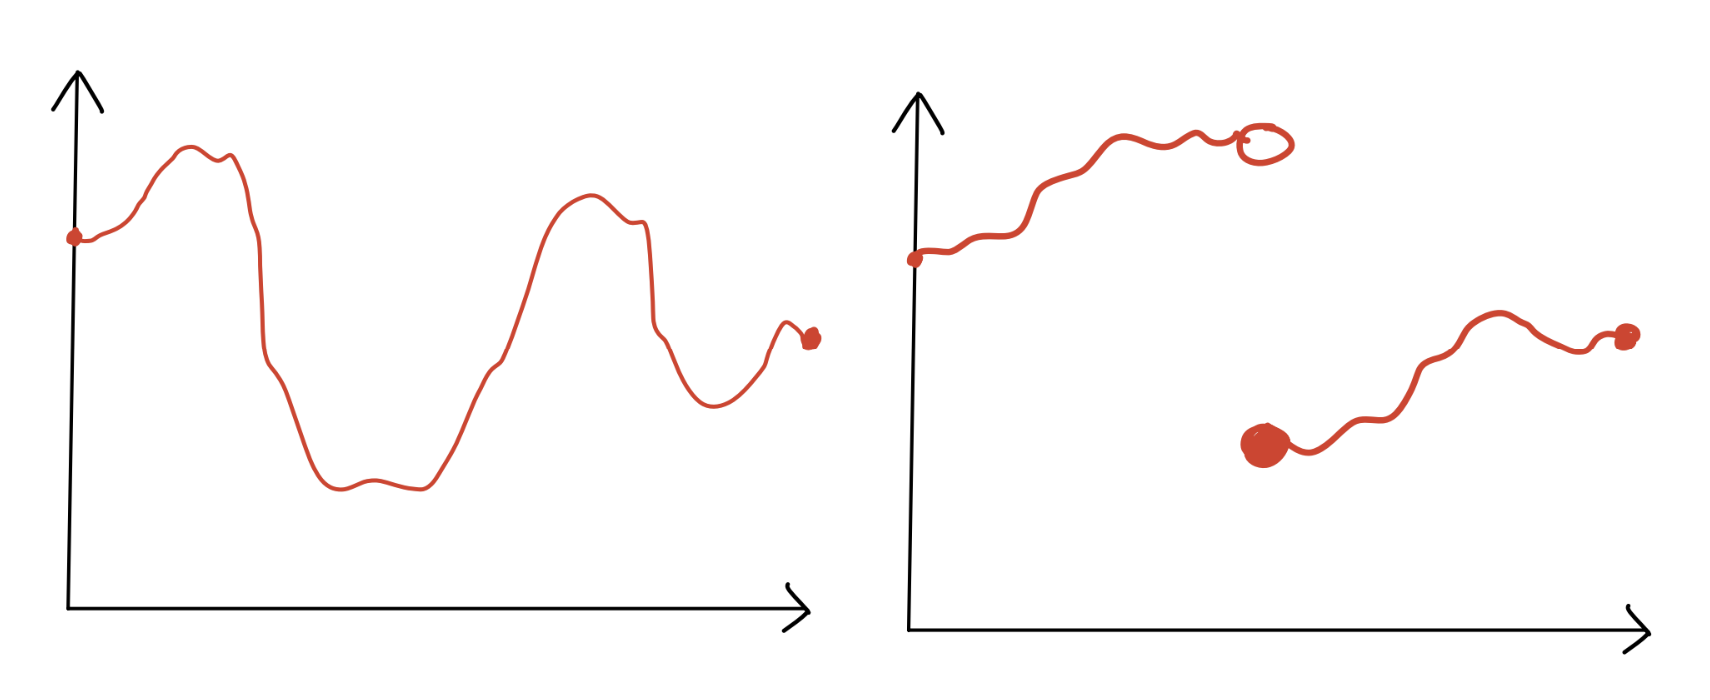
Let’s look at these two functions here.
The left function is continuous. You can draw it without lifting your pencil off the paper.
The right is not continuous. To draw it, you’ll have to lift your pencil off the paper at the discontinuity.
remember this picture!
Imagine you have a dotted green line on top of the graph.
Now imagine moving it up and down.
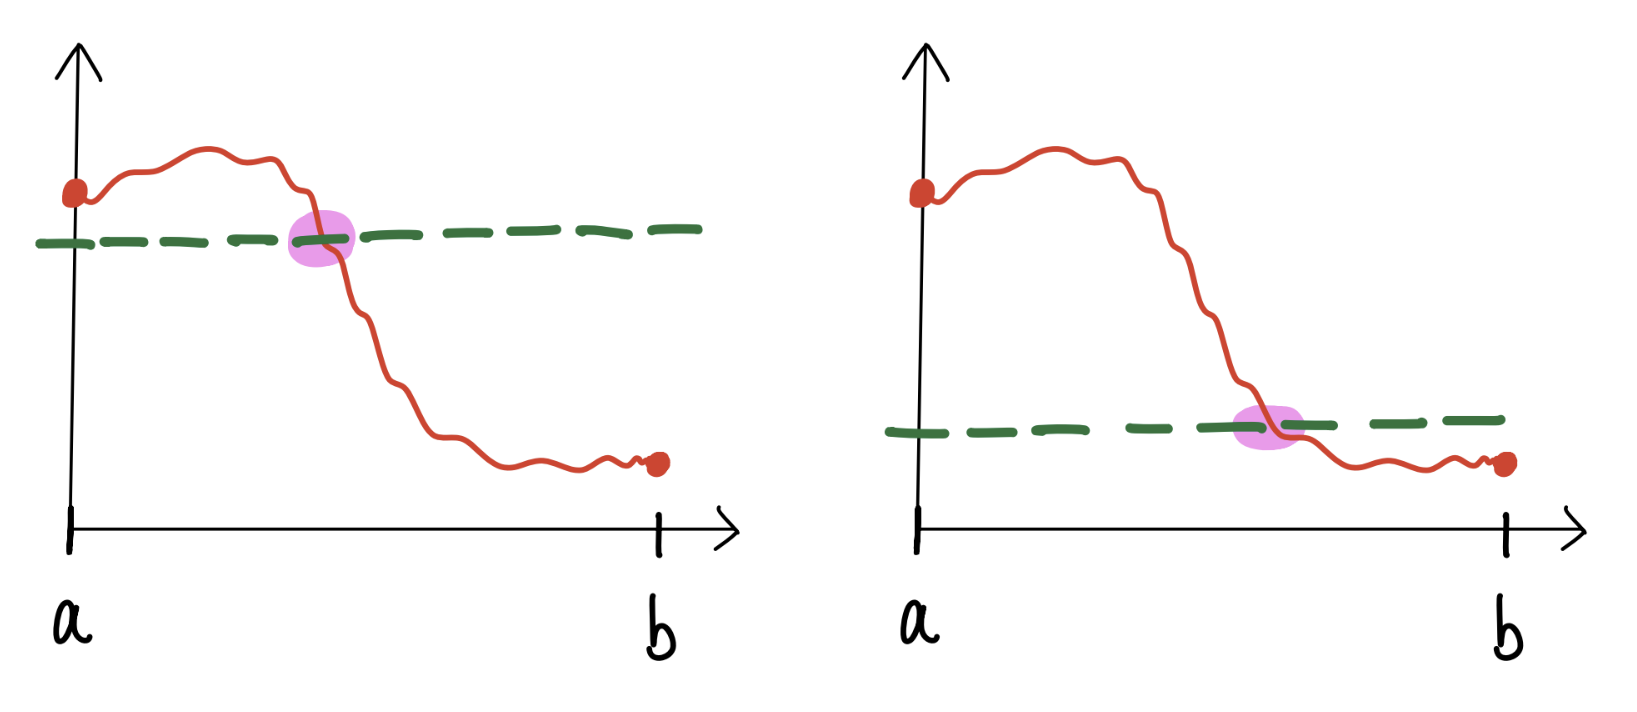
Here’s the key observation about this picture:
No matter where the green dotted line is, it always* intersects the graph of the function at some point.
(*Caveat: As long as the green dotted line is between the max / min value of the function.)
The Intermediate Value Theorem (IVT) says that all continuous functions have this property.
In other words, every dotted line (between the max / min of the function) must hit the graph of the function at least once.
stating the IVT precisely
Suppose you have a continuous function
Then for any number c satisfying
there is a point x in the interval (a,b) such that
In plain English, if the graph of a continuous function travels from f(a) to f(b), it must hit every value in between f(a) and f(b). Every dotted line between f(a) and f(b) must intersect the graph of the function at least once.
the temperature puzzle
So how does this tell us about the temperature of the Earth?
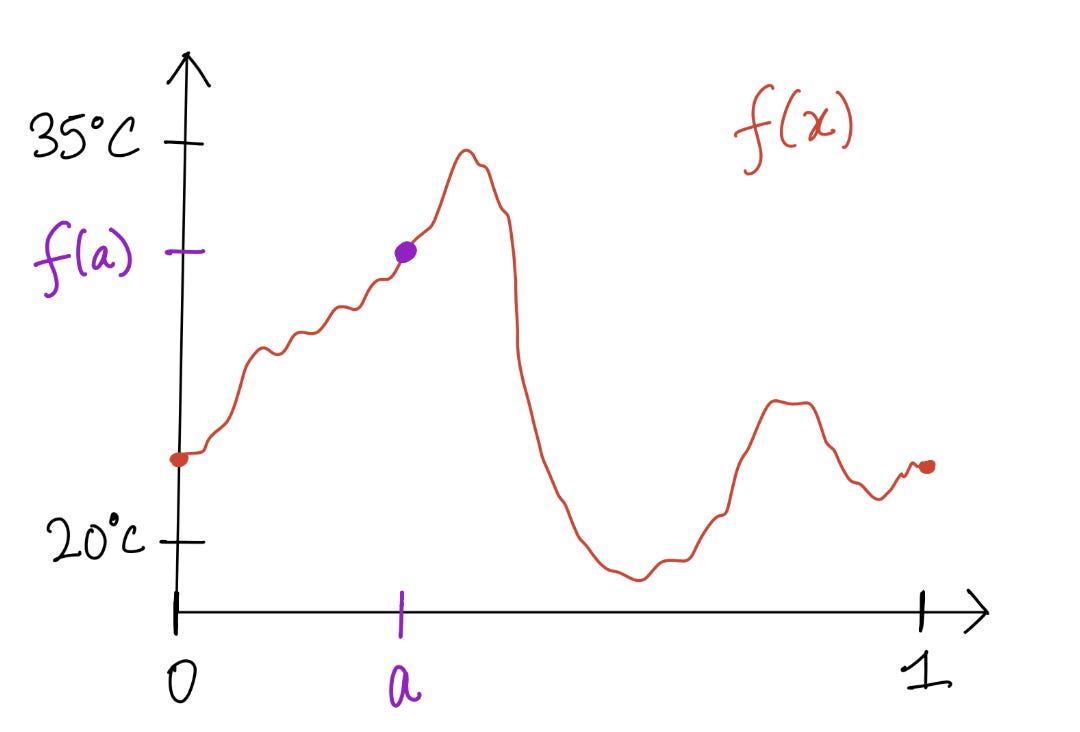
Well first, let’s represent the Equator as an interval from 0 to 1.
Let’s define a function that assigns to each point of the Equator its temperature. Maybe it looks something like this:
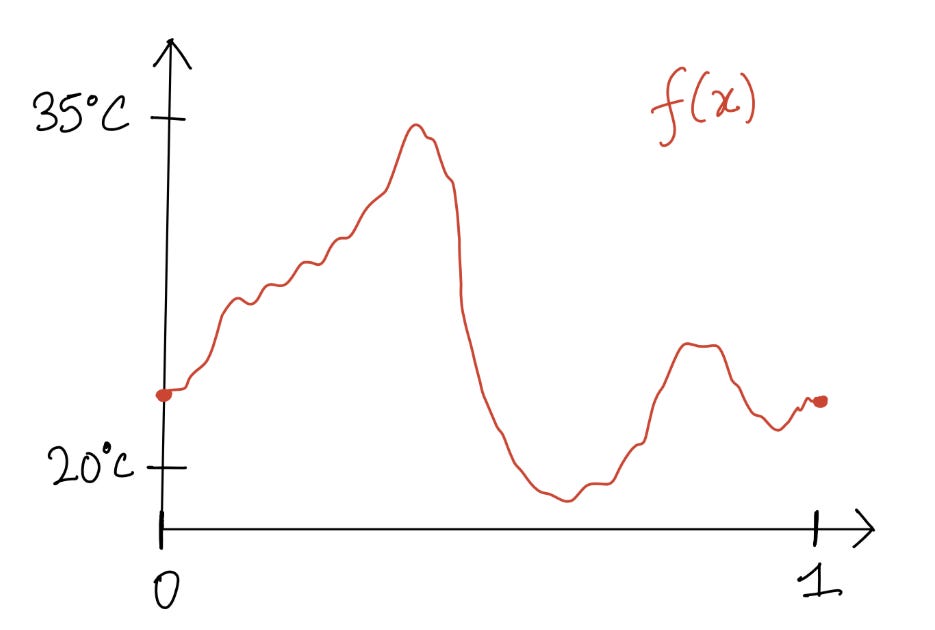
(This is not based on actual temperature data; it’s just for illustration purposes.)
Here’s two important features of this function f:
We’ll assume that it’s continuous. I’d say this is reasonable because the temperature should not suddenly jump if you keep walking in one direction.
We have f(0) = f(1). This is because the points 0 and 1 represent the same location on Earth.
in comes the IVT …
Now, suppose the function is non-constant. (If it’s constant, then there are obviously two points with the same temperature!)
Then there’s a value a between 0 and 1 for which f(a) is different from f(0) and f(1). Maybe it looks like this:
Now draw a dotted line anywhere between f(0) and f(a), say at height c.
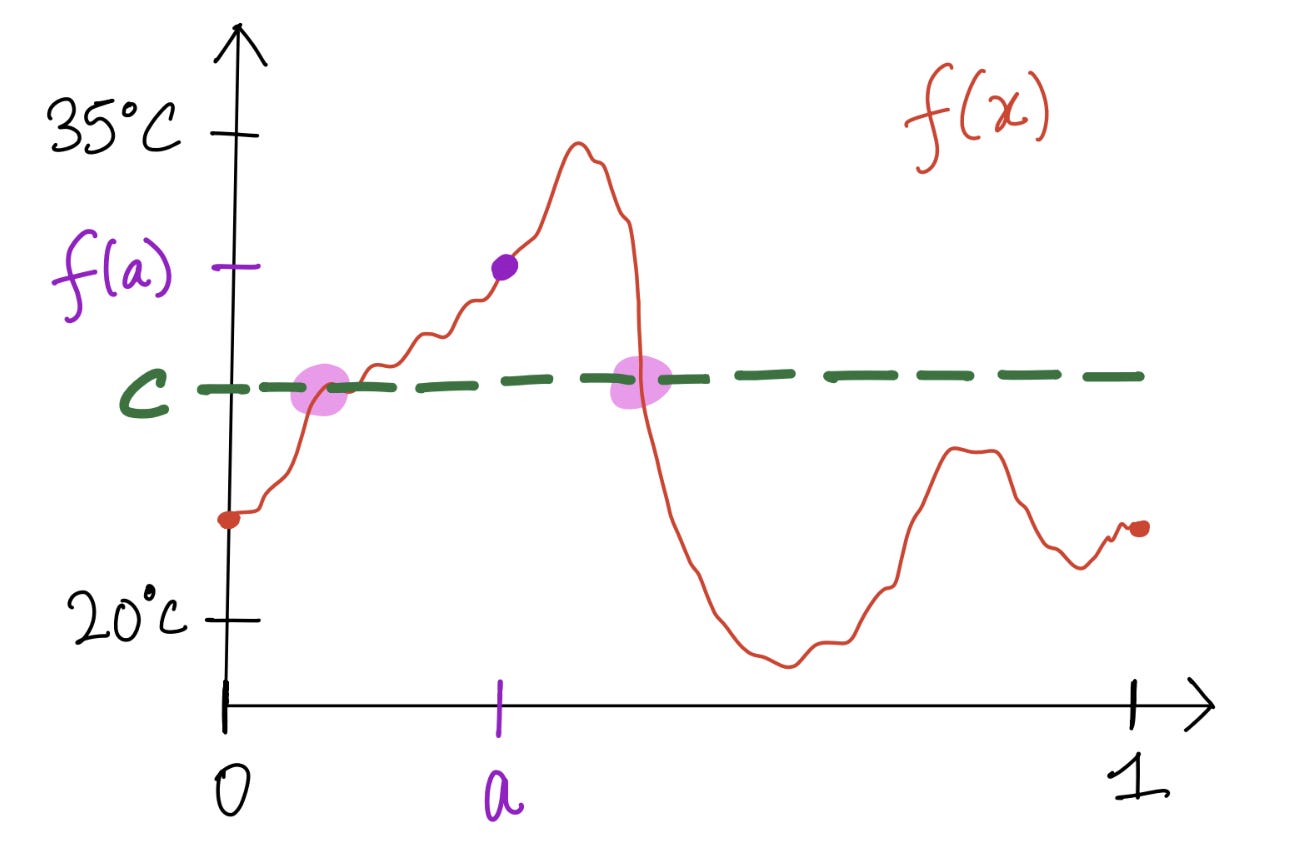
Notice that the dotted line intersects the graph in (at least) two points -- this is what we want to show precisely using the IVT.
Apply the IVT on the left side of the purple point a. The dotted line must intersect the graph at some point. Precisely, there is a point x1 such that
Now apply the IVT on the right side of the purple point a. There is a point x2 such that
Therefore we’ve found two points x1 and x2 on the Equator with the same temperature c. We’re done!
problem of the week
Here is the challenge problem for this week:
A positive integer is the product of n distinct primes. In how many ways can it be represented as the difference of two squares?
Got a solution to the challenge problem? Submit it here.
See here for the solution to last week’s problem. Shoutout to Ishan Panpaliya from Washington for submitting a solution to last week’s problem!
Thank you to Jay Tipirneni (San Francisco, CA), Ishan Panpaliya (Washington), Scotus (Finland), David Fetter (Elk Grove, California), David J. Webb (Hawaii), and Tejas Acharya (Singapore) to submitting solutions to last week’s problem!
Thanks and happy learning,
Adithya